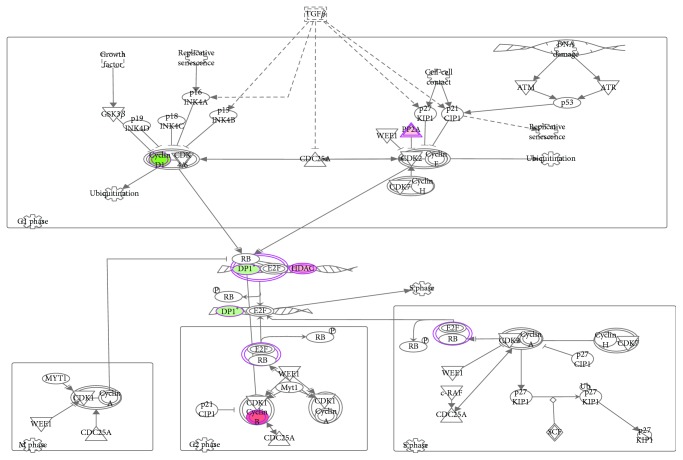
Figure 4.
Cyclins and cell cycle regulation is the top pathway downregulated by citalopram treatment. This figure represents the cyclins and cell cycle regulation pathway as the top signaling pathway downregulated with a significant p value (p value = 1.98E − 02) due to citalopram treatment. IPA identifies this pathway as it involves differentially methylated genes from our dataset like cyclin B, HDAC, and P2A that are upregulated (red) and cyclin D1 and Dp1 that are downregulated (green). The color intensity is proportional to the extremity of upregulation or downregulation.

