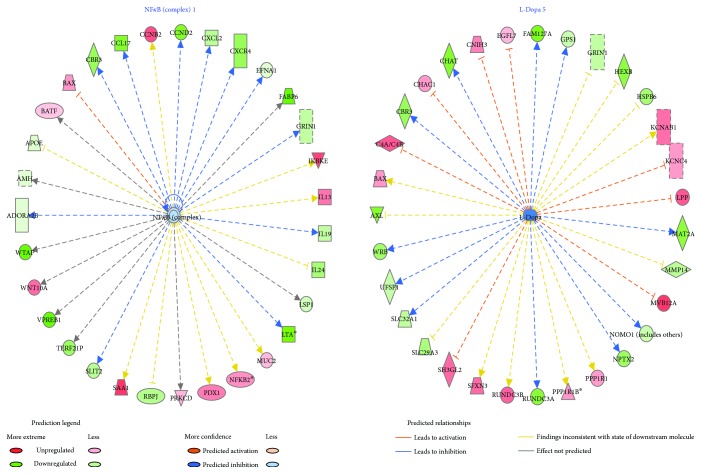
Figure 5.
NFκB complex 1 and L-dopa 5 identified as upstream regulators with predicted inhibition. This figure represents the two upstream regulators with predicted significant differential regulation resulting from citalopram treatment based on the methylation states (hypermethylated or hypomethylated) of their downstream targets by ingenuity pathway upstream regulator analysis. NFκB complex 1 is a transcription factor predicted with a higher degree of inhibition (green) with p value = 1.79E − 04. L-Dopa, the initial substrate for neurotransmitter dopamine, is also predicted to be inhibited (green) at a lower degree with p value = 1.22E − 03. With upstream regulators NFκB complex 1 and L-dopa at the center, the dotted lines with arrow indicate downstream target genes that are upregulated (red) or downregulated (green) due to differential methylation as indicated in our dataset. A dashed line means indirect interaction, continuous line means direct interaction, line with arrow means “acts on” and line with bar at the end means “inhibits.” These basic relationships between molecules represented in the figure are based on literature-reported effects, and the color coding represented in the legend is used for correlation of known relationships with observed gene expression effects resulting from treatment of citalopram. For example, based on literature, L-dopa indirectly acts on SLC32A1, a polyamine transporter. However, in the presence of citalopram, L-dopa bioavailability is decreased, and it is predicted to have an inhibitory effect on SLC32A1 indirectly such that it is downregulated.

