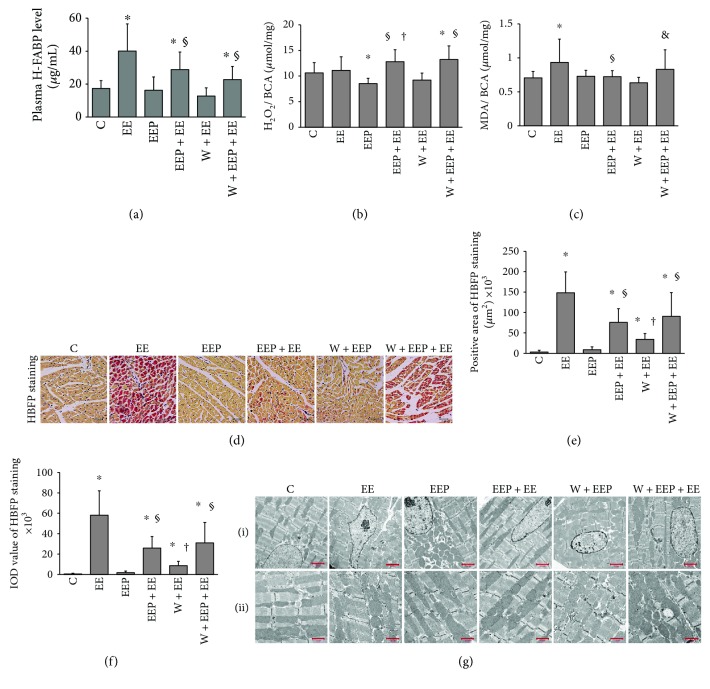
Figure 1.
EEP provides cardioprotection against exhaustive exercise and is partly attenuated by the autophagy inhibitor wortmannin. (a) Changes in plasma H-FABP levels. Comparison of group EE to C, EEP + EE to C and EE, and W + EEP + EE to C and EEP + EE showed significant differences (P < 0.05). (b) Changes in H2O2 levels. Comparison of group EEP to C, group EEP + EE to EE and EEP, and group W + EEP + EE to C and EE showed significant differences (P < 0.05). (c) Changes in MDA levels in the myocardium. Comparison of group EE to C, EEP + EE to EE, and W + EEP + EE to EEP + EE showed significant differences (P < 0.05). (d) HBFP staining showed myocardial hypoxia-ischemia. The cytoplasm of nonischemic myocardial cells is stained brown. The hypoxic-ischemic area stains bright crimson. Groups EE and W + EEP + EE clearly depict hypoxia-ischemia. Original magnification was ×400, bar = 20 μm. (e and f) HBFP staining and changes in integral optical density (IOD). Both data presented distinct patterns. Comparison of group EE to C, EEP + EE to C and EE, W + EEP to C and EEP, and W + EEP + EE to C and EE showed significant differences (P < 0.05). (g) Electron micrographs showed changes in myocardial ultrastructure in six different conditions. (g, i) Original magnification was ×1.5 K, bar = 2.0 μm. Images showed morphological alterations in group EE that included karyotheca swelling, chromatin margination, myofibrillae breakage, and decrease in size and shape of the mitochondria into spheres, thereby indicating ultrastructural damages. Groups EEP and EEP + EE depict normal ultrastructural features. EEP presented numerous mitochondria that were distributed around the nucleus, which were not observed in the EEP + EE group. The groups W + EEP and W + EEP + EE exhibited EE-like morphological changes. W + EEP + EE showed excessive generation of mitochondria between myofibrillae. (g, ii) Original magnification was ×3.0 K, bar = 1.0 μm. Images depict magnified ultrastructural images of the mitochondria. Groups C and EEP and EEP + EE showed normal mitochondrial morphology. Group EE was associated with mild swelling. Group W + EEP was associated with serious swelling. Group W + EEP + EE was associated with abnormally hyperplastic alterations. ∗Compared to C; §compared to EE; †compared to EEP; &compared to EEP + EE. C: control; EE: exhaustive exercise; EEP: early exercise preconditioning; EEP + EE: early exercise preconditioning plus exhaustive exercise; W + EEP: wortmannin plus early exercise preconditioning; W + EEP + EE: wortmannin plus early exercise preconditioning plus exhaustive exercise.

