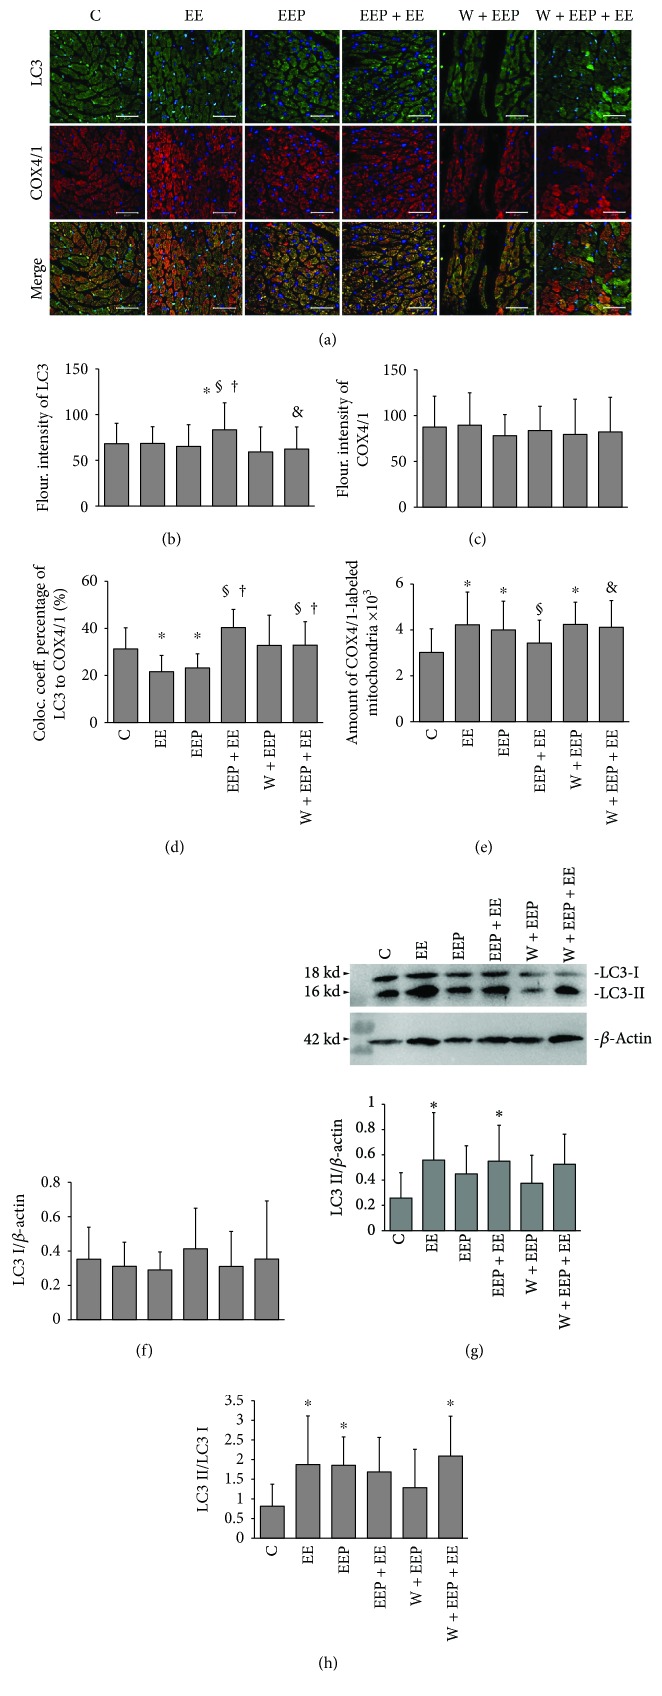
Figure 2.
Changes in LC3 expression and mitochondrial translocation during EEP-induced cardioprotection. (a) The scanning immunofluorescence images of LC3 shows green immunoreactive products that are evenly distributed within the myocardium, which includes Pro-LC3, LC3I, and LC3II. The LC3II-dependent autophagic fluxes appeared as bright spots. The images of COX4/1 show red immunoreactive products that are distributed as granular aggregates in the myocardium of high fluorescence intensities. The merged images show a more dispersed distribution of green and red fluorescence in groups EE and EEP. Original magnification was ×400, bar = 20 μm. (b) Changes in fluorescence intensity of LC3. Comparison of group EEP + EE to C, EE, and EEP, and W + EEP + EE to EEP + EE showed significant differences (P < 0.05). (c) No differences in fluorescence intensity of COX4/1 were observed among groups. (d) Colocalization coefficient of LC3 to COX4/1 expressed as the percentage. Comparison of groups EE and EEP to C and that of groups EEP + EE and W + EEP + EE to EE and EEP showed significant differences (P < 0.05). (e) Changes in the number of COX4/1-labeled mitochondria. Comparison of groups EE, EEP, and W + EEP to C, group EEP + EE to EE, and group W + EEP + EE to EEP + EE showed significant differences (P < 0.05). (f) Changes in immunoblotting levels of LC3I, indicating no differences among groups. (g) Changes in LC3II expression based on blotting. Comparison of groups EE and EEP + EE to C showed significant differences (P < 0.05). (h) Changes in the ratio of LC3II to LC3I. Comparison of groups EE, EEP, and W + EEP + EE to C showed significant differences (P < 0.05). ∗Compared to C; §compared to EE; †compared to EEP; &compared to EEP + EE. C: control; EE: exhaustive exercise; EEP: early exercise preconditioning; EEP + EE: early exercise preconditioning plus exhaustive exercise; W + EEP: wortmannin plus early exercise preconditioning; W + EEP + EE: wortmannin plus early exercise preconditioning plus exhaustive exercise.

