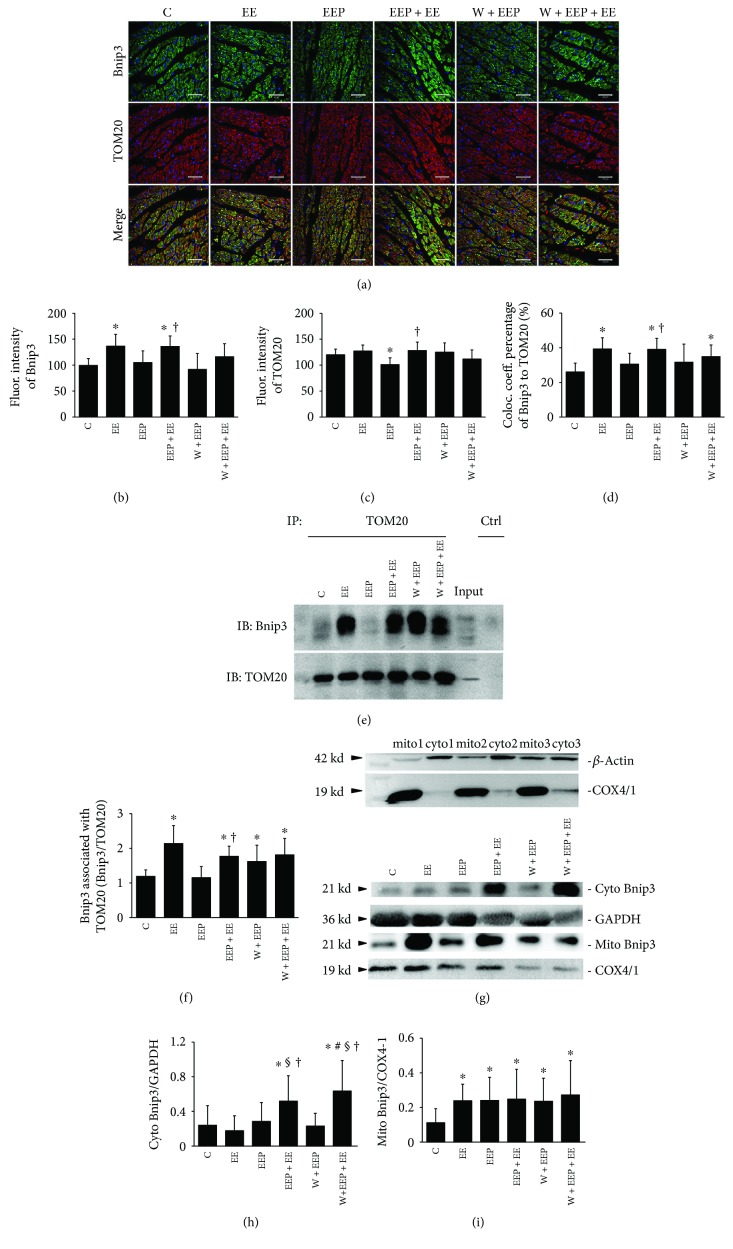
Figure 3.
Changes in Bnip3 expression and mitochondrial translocation during EEP-induced cardioprotection. (a) Scanning immunofluorescence images of Bnip3 (green), which is dispersed across the myocardium; several cardiomyocytes in the EEP + EE group showed high-intensity fluorescence. TOM20 (red) is distributed as granular aggregates in the myocardium. The merged images show distinct differences in the distribution of red and green signals in the cardiomyocytes. Original magnification was ×400, bar = 20 μm. (b) Changes in fluorescence intensity of Bnip3. Comparison of group EE to C and that of group EEP + EE to C, EE, and EEP showed significant differences (P < 0.05). (c) Changes in the fluorescence intensity of TOM20. Comparison of groups EEP to C, groups EEP + EE and W + EEP to EEP, and group W + EEP + EE to EE, EEP + EE, and W + EEP showed significant differences (P < 0.05). (d) Colocalization coefficient of Bnip3 to TOM20 as expressed as a percentage. Comparison of groups EE to C, EEP + EE to C and EEP, and W + EEP + EE to EEP showed significant differences (P < 0.05). (e) Coimmunoprecipitation experiment between Bnip3 and TOM20. IP: immunoprecipitated proteins; IB: immunoblotting proteins; Input: original expressions to Bnip3 and TOM20 in the nonimmunoprecipitated sample; Ctrl: negative control using IgG to replace TOM20 antibody. (f) Changes in the expression of Bnip3 blotting by TOM20 immunoprecipitation. Comparison of groups EE, EEP + EE, W + EEP, and W + EEP + EE to C and that of group EEP + EE to EEP showed significant differences (P < 0.05). (g) Test of mitochondrial isolation was performed using COX4/1 and β-action blotting in separated mitochondrial and cytosolic fractions from three independent cardiac samples, thereby indicating that the isolation was successful. (h) Changes in the expression of cytosolic Bnip3 by using immunoblotting. Comparison of group EEP + EE to C, EE, and EEP and that of group W + EEP + EE to C, EE, EEP, and W + EEP showed significant differences (P < 0.05). (i) Changes in the expression of mitochondrial Bnip3 by immunoblotting, relative to that of COX4/1. Groups EE, EEP, EEP + EE, W + EEP, and W + EEP + EE were significantly different (P < 0.05). ∗Compared to C; §compared to EE; †compared to EEP; &compared to EEP + EE; #compared to W + EEP. C: control; EE: exhaustive exercise; EEP: early exercise preconditioning; EEP + EE: early exercise preconditioning plus exhaustive exercise; W + EEP: wortmannin plus early exercise preconditioning; W + EEP + EE: wortmannin plus early exercise preconditioning plus exhaustive exercise.

