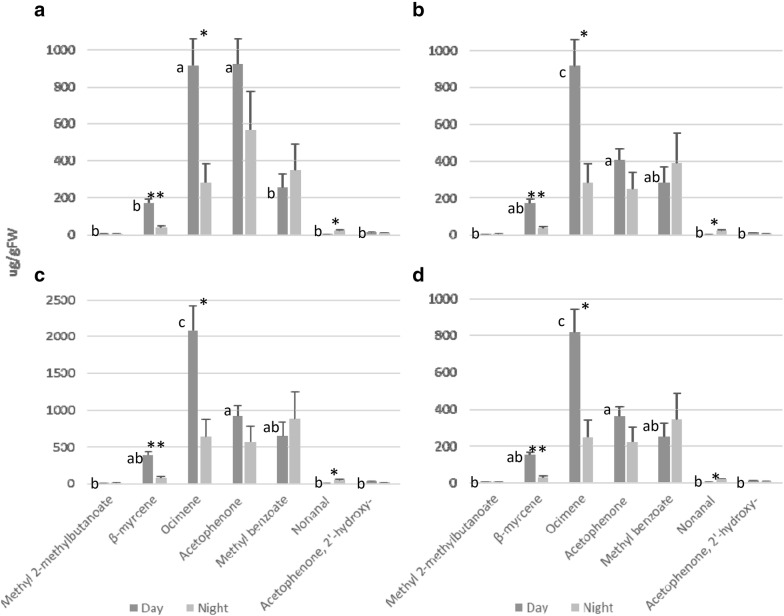
Fig. 5.
Semi-quantification of VOC compounds emitted by A. majus flowers via external calibration curves carried out in the sampling system without flowers. a Application of the NearestRT calibration curve. b Application of single calibrator ocimene. c Application of single calibrator acetophenone. d Application of single calibrator methyl benzoate. Semi-quantifications were applied to raw data from day and night. Figures show the mean values in µg gFW−1 of three samples for each compound and error bars indicate the standard error. Different letters indicate statistical differences between compounds during the day. Asterisks indicate statistical differences of individual compound between day and night

