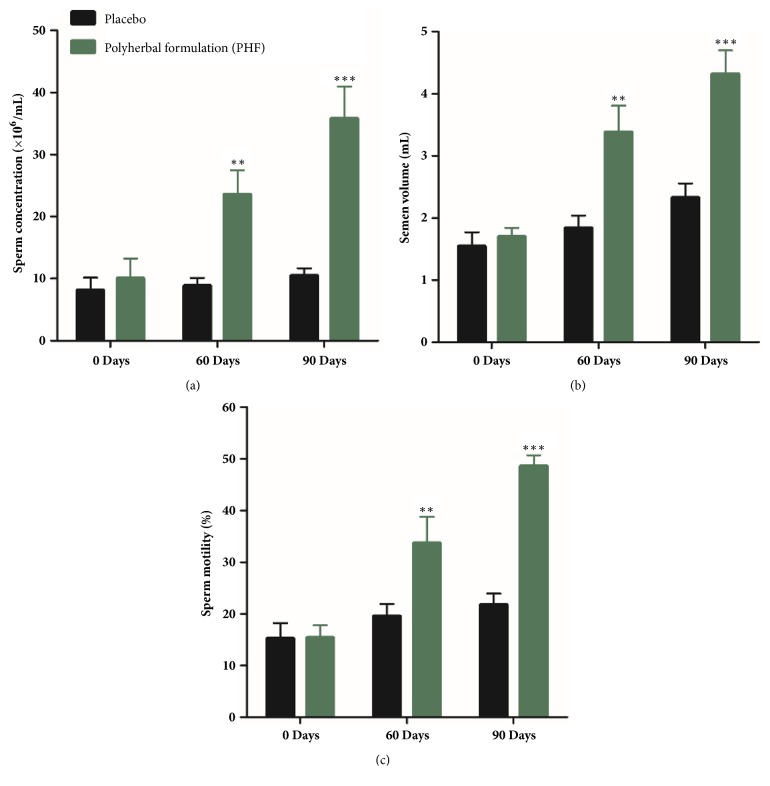
Figure 1.
(a) Sperm concentration (×106/mL), (b) semen volume (mL), and (c) sperm motility (%) in the full-spectrum PHF treated group and placebo group including oligospermic males. ∗∗P ≤ 0.001 as compared to baseline values on Day 0 of the study duration of 3 months. Values are expressed as mean ± SD.

