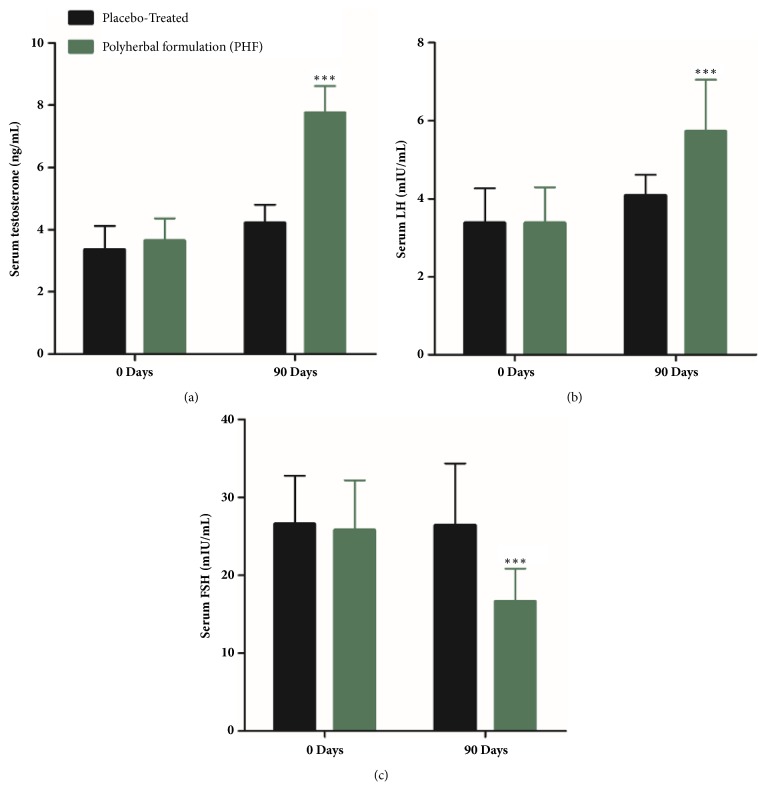
Figure 2.
(a) Serum testosterone levels (ng/mL), (b) serum LH (mL IU/mL), and (c) serum FSH (mL IU/mL) in the full-spectrum PHF treated group and placebo group including oligospermic males. ∗∗P ≤0.001 as compared to baseline values on Day 0 of the study duration of 3 months. Values are expressed as mean ± SD.

