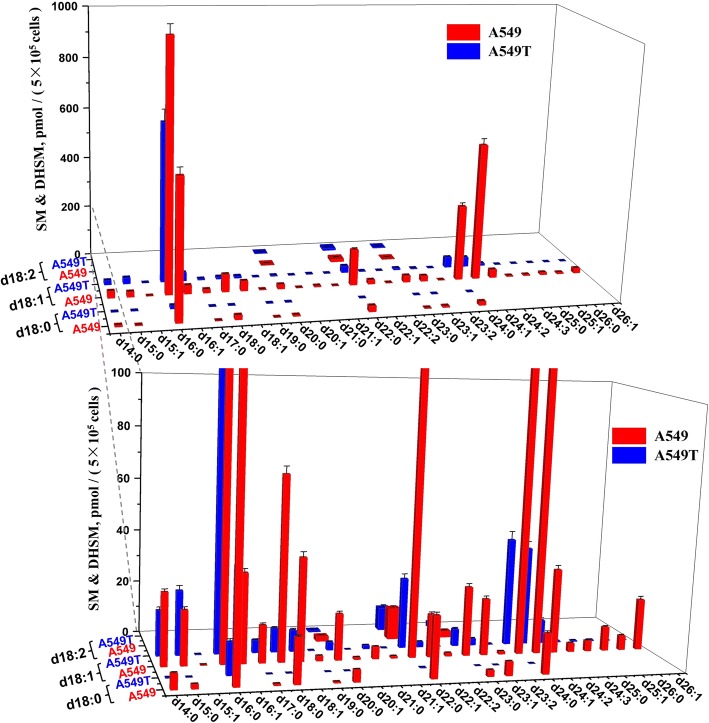
Fig. 4.
Content of SM and DHSM in A549 and A549T. The X and Z axis represent the compose of fatty acid acyl chain and backbone chain, respectively. Comparisons were performed by the non-parametric Mann-Whitney test. Most SMs and DHSMs showed statistical significance between A549 and A549T (P < 0.0001), except for SM (d18:1/16:1) and SM (d18:2/23:0) (P > 0.05)

