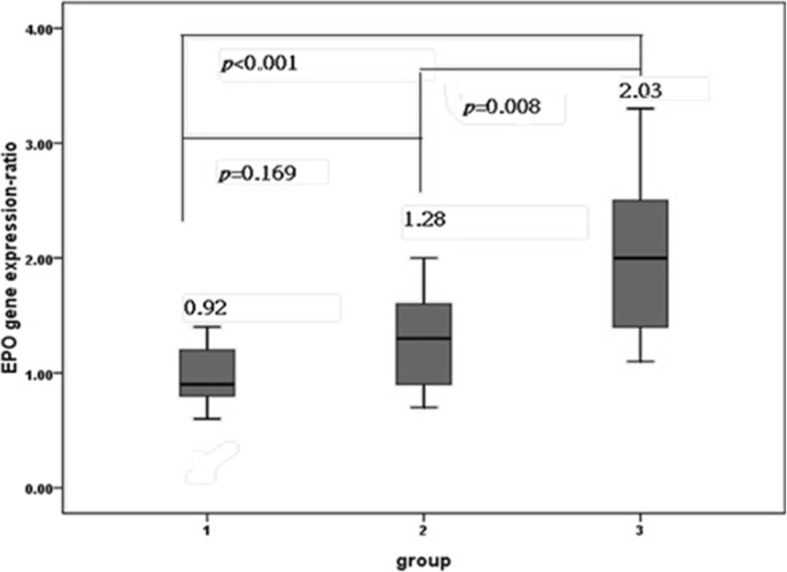
Fig. 1.

Placental EPO gene expression ratios in three groups of MC twins. The placental EPO gene expression ratio was significantly higher in Group 3 (one-way ANOVA, p < 0.001), but no significant differences were observed between Groups 1 and 2 (post hoc comparison using the LSD test). The placental EPO gene expression ratios for the two placental territories in a twin pair are presented as fold changes between the two fetuses in MC twins: (the relative EPO expression concentrations of the sIUGR twin)/ (relative EPO expression concentrations of the larger twin). A higher EPO gene expression ratio (as shown in group 3) indicated more EPO expression by the placental territory of the sIUGR twin. Data are expressed as means and ranges of values. Group 1: normal MC twins; Group 2: twins with sIUGR but without UA Doppler abnormalities; and Group 3: twins with sIUGR and UA Doppler abnormalities. Abbreviations: EPO: erythropoietin; MC: monochorionic; sIUGR: selective intrauterine growth restriction; AGA: appropriate for gestational age; UA: umbilical artery; LSD: least significant difference
