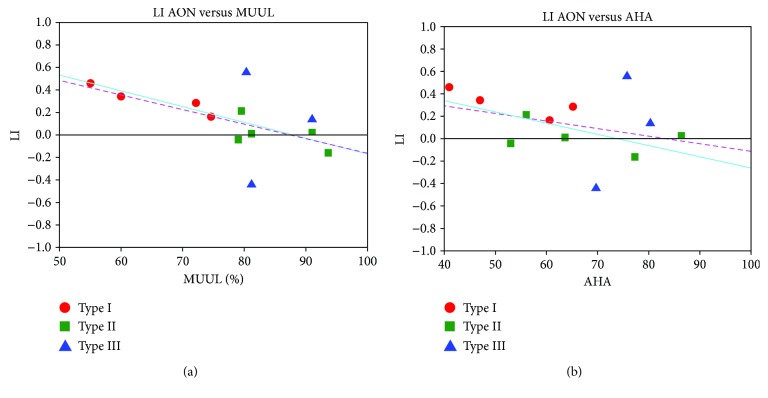
Figure 5.
Lateralization index (LI) for the observation of all object-related actions versus BASELINE for each UCP child, plotted against his/her clinical scores (MUUL scale on panel a; AHA scale on b). Children were represented with different colours and symbols according to the classification of their lesions (type I = red circles, type II = green squares, type III = blue triangles). Data were fitted with a standard linear function. Considering all the subjects, the correlations are not significant (Pearson's value R = −0.55, p = 0.06 for MUUL; R = −0.34, p = 0.28 for AHA; pink dotted line). They become significant when only children with lesions of type I and type II are used in the fit (R = −0.90, p = 0.0007 for MUUL; R = −0.68, p = 0.04, for AHA; cyan solid line), due to big variability of data from children with type III lesion.

