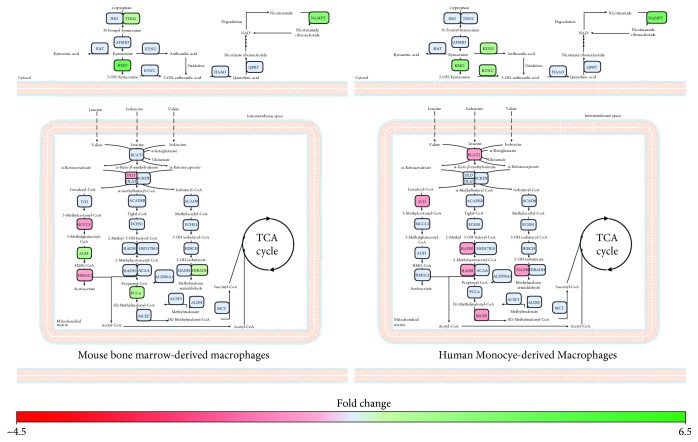
Figure 6.
Tryptophan and branched-chain amino acid catabolism is altered in BMM and MDM following short-term IFN-α treatment. Metabolic genes altered in IFN-α-stimulated cells compared to controls (−1.2 ≤ FC ≥ 1.2, p value ≤ 0.05, FDR ≤ 0.1) were mapped to amino acid metabolism pathways using MetScape and DAVID. Green and red represent genes that have been significantly upregulated or downregulated, respectively. Blue represents genes that were not altered following IFN-α stimulation.

