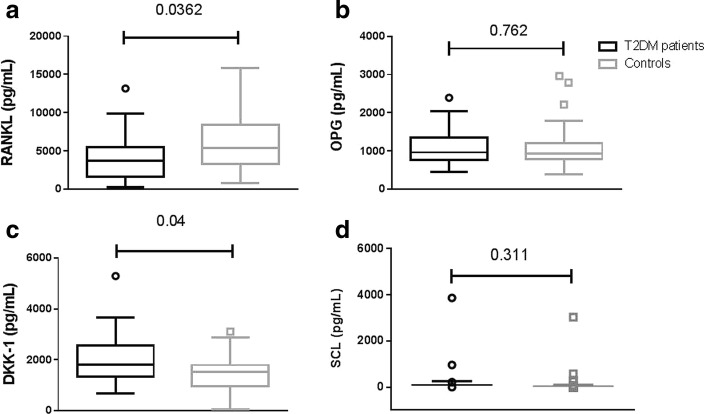
Fig. 2.
Graphs show cytokines involved in the control of bone cells formation and activity in T2DM patients and controls. Panel a: RANKL; Panel b: OPG; Panel c: DKK-1. Panel d: SCL. Box and whiskers plot displays median, the first and third quartiles, and the minimum and maximum of the data. P value was calculated with by Mann-Whitney test and is shown in the graph when significant

