
Fig. 3.
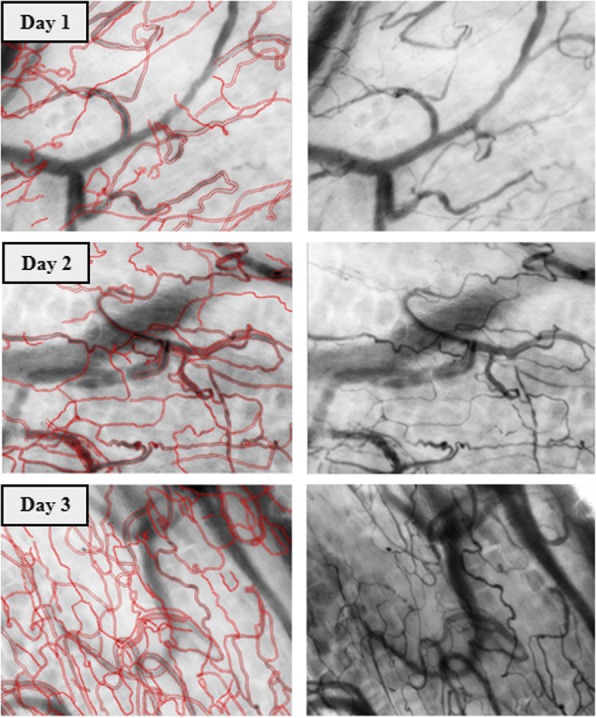
Cytocam-IDF images of sublingual microcirculation—a visual representation of the increase of the TVD. Images of sublingual microcirculation video clips obtained from one patient on day 1 (T0), day 2 (T1), and day 3 (T2) after ICU discharge. The red lines indicate the vessels smaller than 25 μm and represent the TVD within the entire image