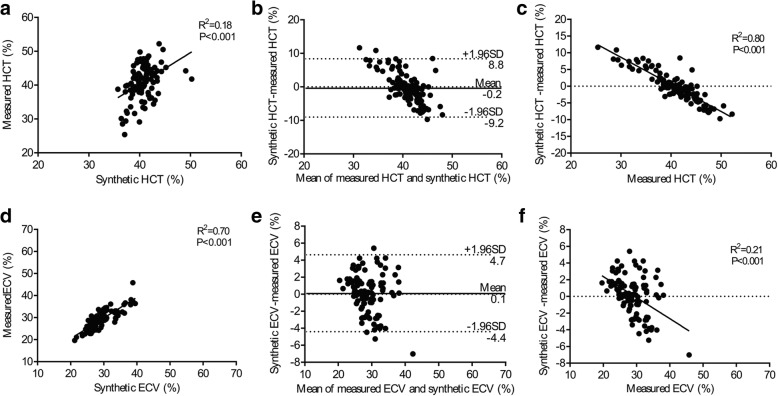
Fig. 3.
Correlation among the HCTm, HCTsyn, ECVm, ECVsyn in the validation group. There was modest correlation between the HCTsyn and HCTm (a) and strong correlation between the ECVsyn and ECVm (d). Bland-Altman analysis indicated minimal bias between the HCTsyn and HCTm (b) and between the ECVsyn and ECVm (e). HCTm strongly correlated with (HCTsyn –HCTm) (c) and the ECVm modestly correlated with (ECVsyn – ECVm) (f)

