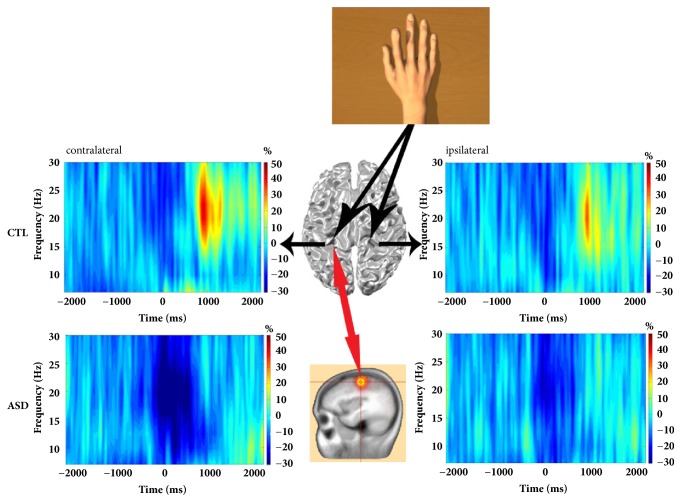
Figure 2.
Grand average of time-frequency spectra of CTL (control, top) and ASD (bottom) children. TFR plots are derived from beamforming source images localized in the contralateral and ipsilateral motor areas and time-locked to movement termination (accelerometer onset). Cortical oscillations in the mu- (8-13Hz) and beta- (15-30Hz) bands showing event-related desynchronization (ERD, blue) at movement onset and postmovement beta rebound (PMBR, yellow-red) time regions are characterized. Source power during the baseline period was subtracted from source power during movement or after the movement intervals. Control subjects had a significant power decrease (ERD) in percent change from baseline in the beta frequency range beginning before movement and lasting throughout the duration of movement as well as a mu-ERD around the movement, which were followed by a strong beta power increase (PMBR) in percent change from baseline beginning shortly after movement termination. On the contrary, ASD subjects had a significantly greater power decrease (ERD) compared to controls in the beta and mu frequencies range beginning before movement and lasting beyond the movement, which was followed by a weak or no beta power increase (PMBR) beginning shortly after movement termination.

