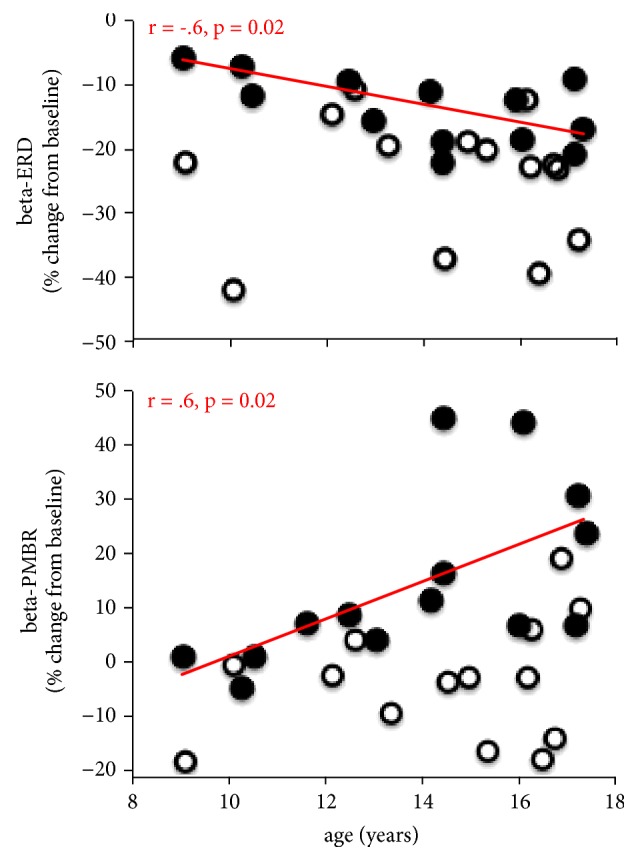
Figure 5.

Beta correlation results. Representative plots of the correlation results assessing the relationship between age of the subjects and contralateral beta-ERD (top) and -PMBR (bottom) power during index imitation. The r values were -.6 for ERD and .6 for PMBR for control participants (closed black circles, red trendline). No significance was found for ASD participants (open black circles) for both ERD and PMBR.
