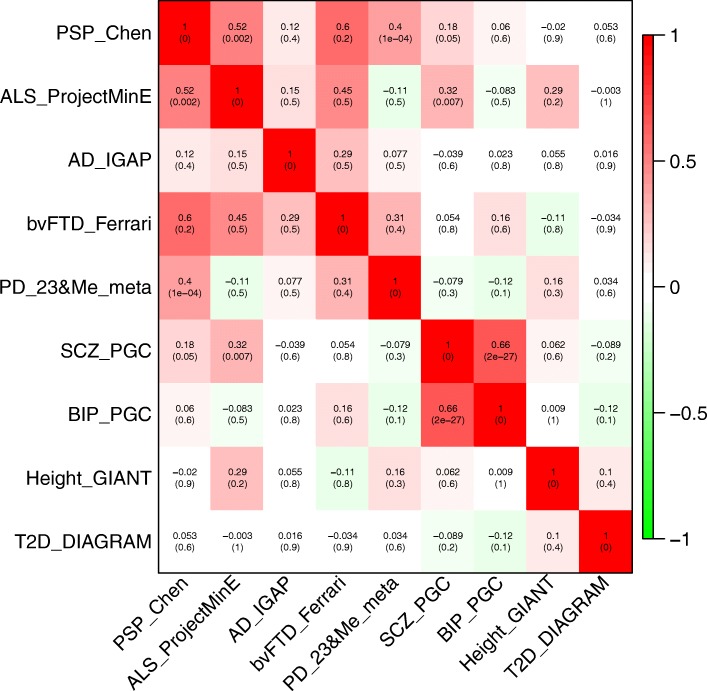
Fig. 3.
Heatmap of genetic correlation between GWAS summary statistics for neurodegenerative diseases (PSP – progressive supranuclear palsy, ALS – amyotrophic lateral sclerosis, AD – Alzheimer’s disease, bvFTD – behavioral variant frontotemporal dementia, PD – Parkinson’s disease), calculated by LDSC. GWAS for non-neurodegenerative phenotypes (SCZ – schizophrenia, BIP – bipolar disorder, height, and T2D– type 2 diabetes mellitus) are also included for comparison. In each cell, the genetic correlation coefficient (and P value in parentheses) is shown. Phenotypes that share a common polygenic background are positively correlated

