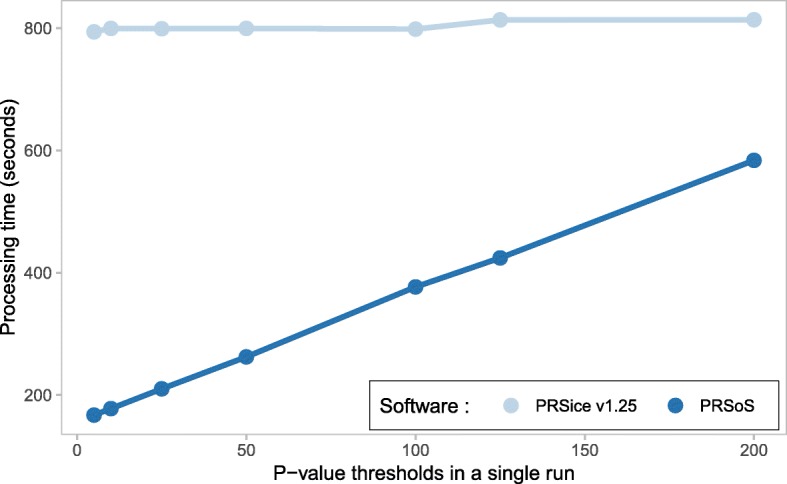
Fig. 4.

PRSice v1.25 and PRSoS performance across increasing number of p-value thresholds. Line plot shows the results of the performance test comparing PRSice v1.25 and PRSoS across increasing number of p-value thresholds to construct in a single run using a dataset based on imputed posterior probabilities converted to “hard calls” (Imputed HC)
