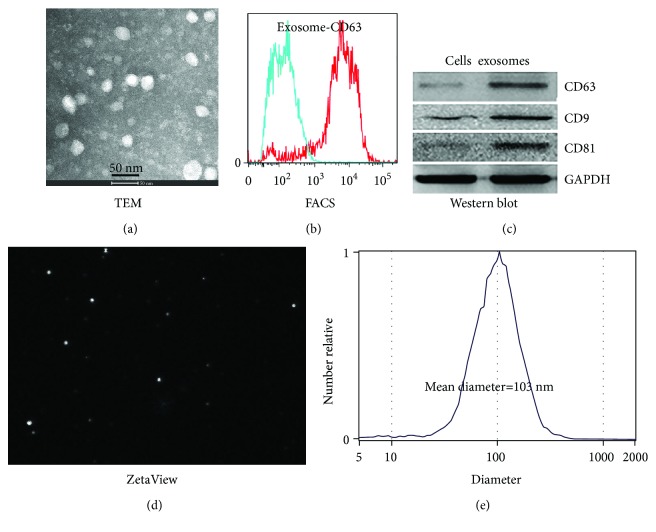
Figure 1.
Characterization of hAEC-Exos. (a) TEM image of hAEC-Exos (n = 5). (b) Flow cytometry analysis of exosomal marker CD63 (n = 4). (c) Western blot analysis of exosomal markers CD63, CD9, and CD81 (n = 3). (d) ZetaView analysis of hAEC-Exos (n = 3). (e) Size distribution of hAEC-Exos (mean diameter = 103 nm, n = 3).

