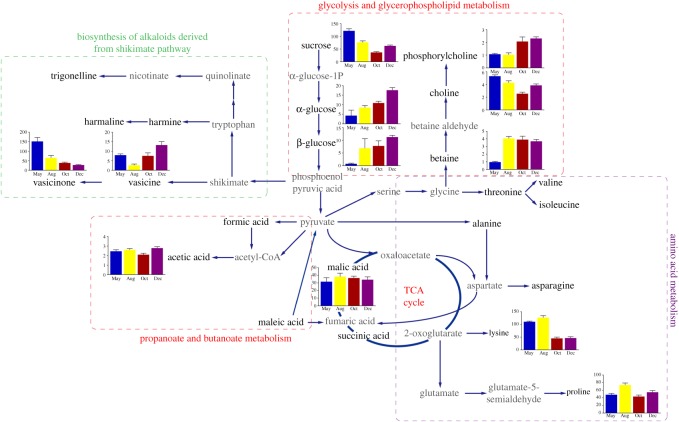
Figure 6.
Schematic metabolic pathway network analysis of P. harmala responses to different growth stages based on the findings and information obtained from the KEGG database. Metabolite changes are represented in bar graphs. Metabolites coloured grey are not detected. Single solid arrows represent one-step process, while two connected solid arrows represent multi-steps process. Dash line boxes with different colour indicate metabolism networks of particular metabolites.

