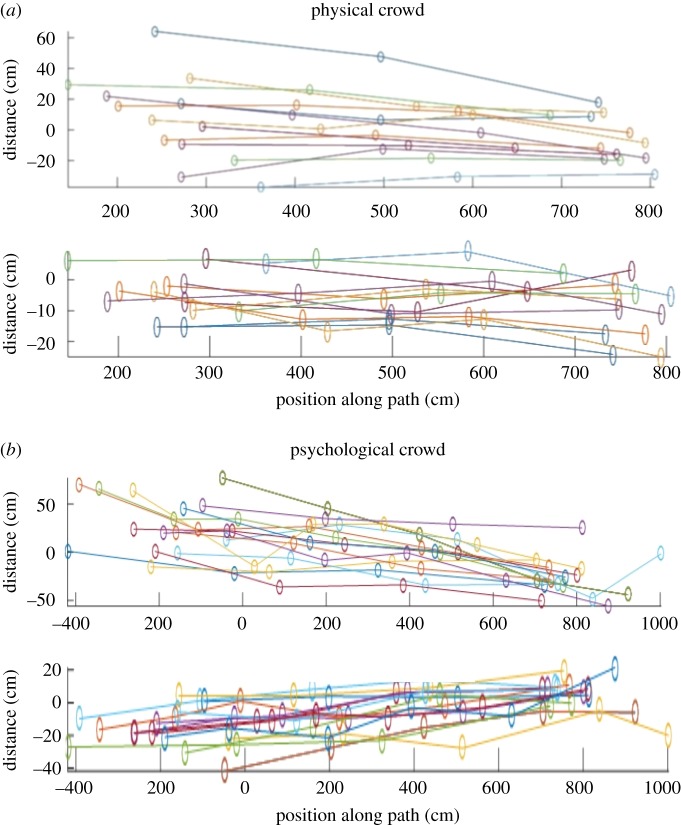
Figure 2.
The distance between projected feet positions and actual feet positions of 14 pedestrians in each crowd. The X axis denotes the movement of the pedestrians from the beginning of the path to the end, with each circle indicating their tracked positions. The Y axis denotes the distance between the projected positions of the feet and the actual positions of the feet from manual tracking. The top figures in each crowd demonstrate the error of projections perpendicular to the camera (error to the left or right side of the pedestrians). The bottom figures demonstrate the error of projections parallel to the camera (in front or behind the pedestrians).

