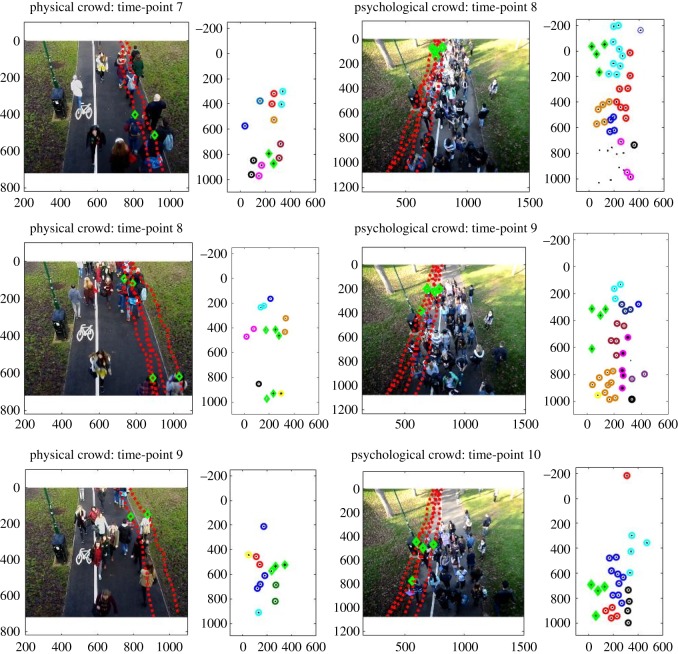
Figure 8.
The progression of groups identified by cluster analysis over three time points in the physical and psychological crowds. Green diamonds denote pedestrians whose trajectories across the entire footage have been demonstrated. The progression of one group is shown in the psychological crowd, but two groups are shown in the physical crowd due to the faster walking pace of the pedestrians meaning that they could not be tracked across all three time-points (note that there are two groups shown in time-point 8 of the physical crowd).

