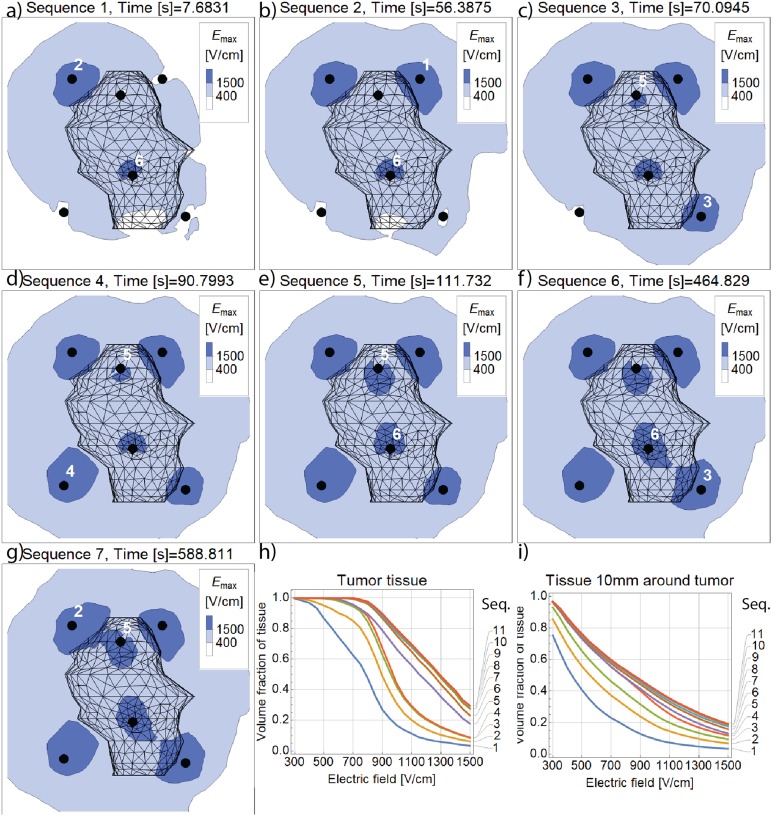
Figure 7.
A-G, Evolution of maximal values of electric field magnitude on the cross section through the middle of the tumor. H, The curves indicate the volume fraction of tumor tissue covered by electric field of at least the strength indicated on the horizontal axis. I, Electric field histogram for the safety margin tissue (10 mm from the tumor) after each successive pulse sequence.

