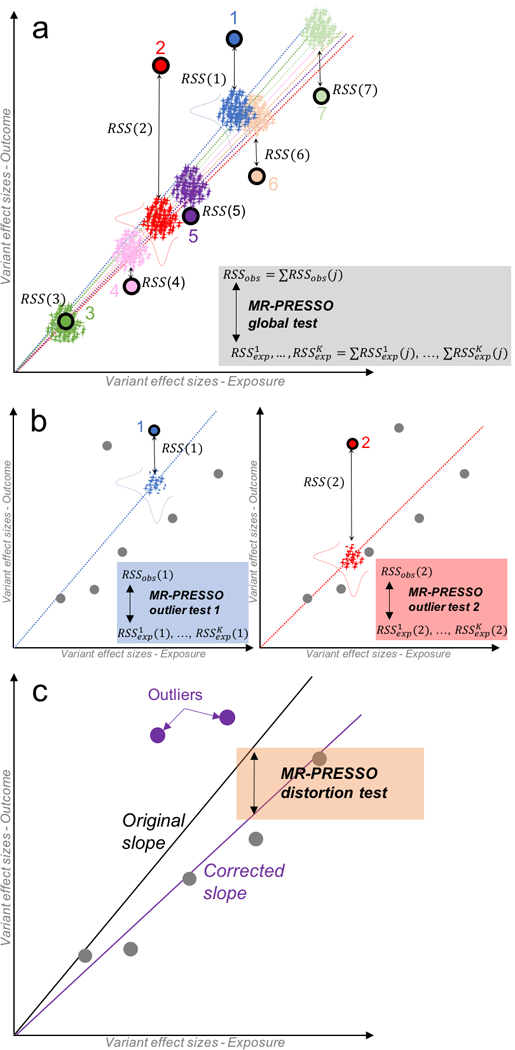
Figure 1: Description of the Mendelian Randomization Pleiotropy RESidual Sum and Outlier (MR-PRESSO) method.

MR-PRESSO is comprised of three components. Panel a represents the global test. For each variant j, a slope, representing the causal estimate, is computed without the variant using standard inverse variance weighted meta-analysis (seven colored dotted lines; each color of the regression line corresponds to the line obtained by excluding the variant of the same color). The observed residual sum of squares RSSobs(j) is computed as the squared difference between the observed effect size of variant j on the outcome and the effect size predicted using the slope computed without j. In addition, K pairs of random effect sizes for the exposure (x-axis) and the outcome (y-axis) (represented as crosses) are drawn from two Gaussian distributions (horizontal and vertical bell curves respectively for the exposure and outcome) from the predicted effect sizes and standard errors using the slope computed without j. A distribution of K expected is then calculated. By summing up the J RSSobs(j), we calculate a global statistic that is compared to the K expected sum of . Panel b represents the outlier test. A test is performed for each variant j by comparing the observed RSSobs(j) to the K expected . Here, only variants (1 and 2) are shown for simplicity. Panel c represents the distortion test. The panel shows how removing significant outliers detected by the MR-PRESSO outlier test (variant 1 and 2) leads to an unbiased slope (causal estimate).
