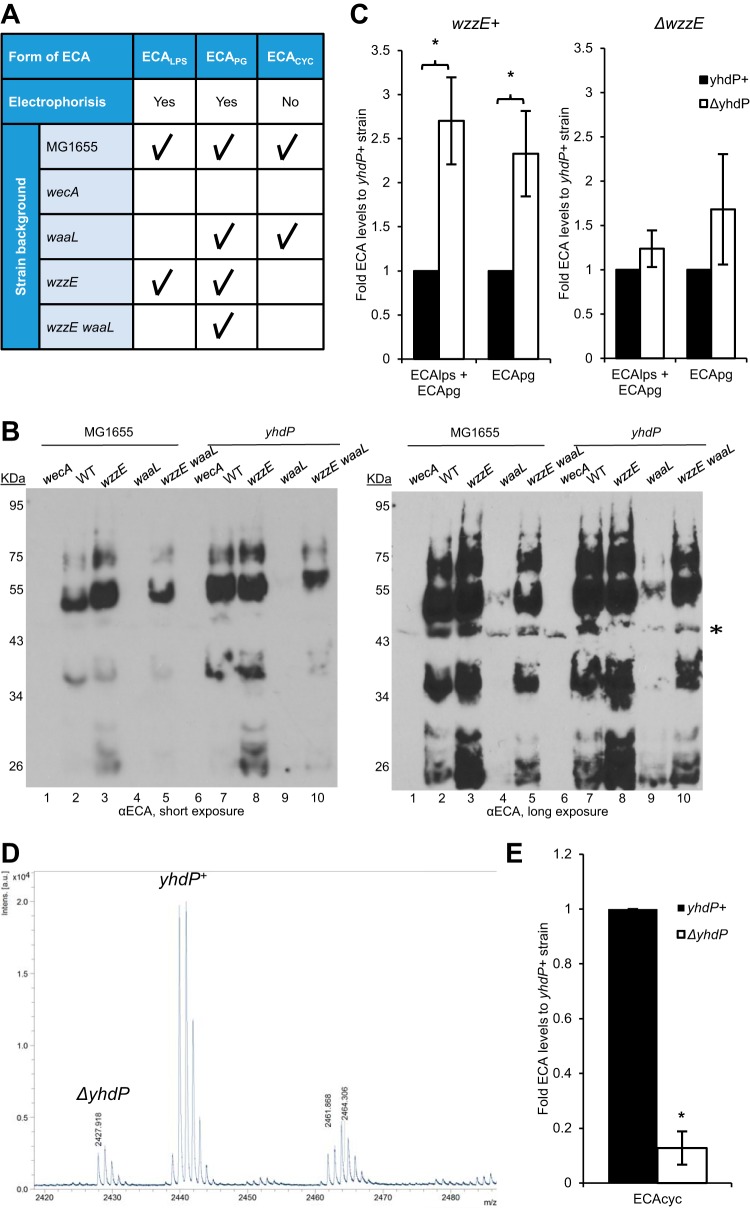
FIG 4 .
YhdP interacts genetically with ECA. (A) Distinctions between forms of ECA are shown in table form, including whether they can be subjected to PAGE analysis and immunoblotting (“electrophoresis”) and which forms are present in genetic backgrounds with the indicated gene deletions. The presence of the form of ECA is indicated with a check mark. (B) Immunoblot analysis was performed for strains with the indicated gene deletions and probed with anti-ECA antibody to assay changes to ECA caused by the yhdP deletion. Strains with no mutations other than yhdP+/− are indicated by WT. Bands from low molecular weights to high molecular weights represent increasing ECA chain lengths. The types of ECA that can be observed in each genetic background are detailed in Fig. 4A. Short and long exposures are shown. *, a nonspecific band. All other bands are forms of ECA. Images are representative of five independent experiments. (C) Densitometry was performed from immunoblots to quantitate levels of the indicated types of ECA in the given background. The levels of membrane-bound ECA were found to be higher with the ΔyhdP strain only when wzzE was present. Fold values compared to the yhdP+ strain are shown as the average of three to five independent experiments ± the SEM. (D) Levels of ECACYC were analyzed by MALDI-TOF with relative values comparing yhdP+ cells labeled with 15N to ΔyhdP cells. Cells were combined before purification to allow for direct comparison of levels of heavy ECACYC (m/z 2,440) and normal ECACYC (m/z 2,428). A representative image is shown and normal and heavy peaks are labeled by their originating strain. The unlabeled higher-molecular-weight species is a modified form of ECACYC. (E) Quantification of ECACYC levels is shown as average relative levels from three biological replicates ± the SEM. Levels of ECACYC were lowered in a strain ΔyhdP background. *, P < 0.05 compared to the yhdP+ strain.

