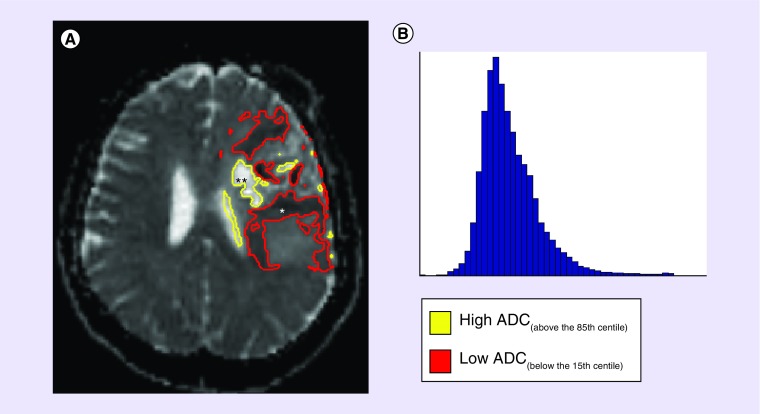
Figure 3. . A pre-treatment ADC scan of GBM (A) can show marked variation of low (*) and high (**) ADC values, which can regionally represent various biological scenarios- low ADC: high tumor or inflammatory cell presence, ischemia or a combination of both; high ADC: vasogenic edema, limited tumor and/or inflammatory cells, necrosis or a combination of any.
Studies assessing distribution of ADC with histogram analyses (B), although providing interesting quantitative data, give no information pertaining to the spatial distribution of ADC throughout the lesion.
ADC: Apparent diffusion coefficient; GBM: Glioblastoma.

