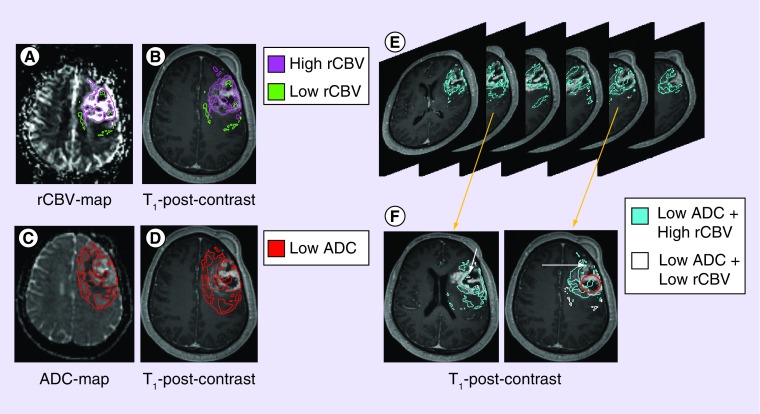
Figure 4. . ADC and rCBV can give better indications of what may be happening within sub-regions of GBM.
rCBV-maps (A) provide clues pertaining to the microenvironment that surrounds cells. Superimposing these sub-regions to T1-post-contrast (B) images provides details pertaining to where these ecosystems may be in relation to the tumor ‘bulk’ (T1-enhancing region)- either within the ‘necrotic core’, within the ‘bulk’, or just outside. Combining this with regional low ADC (C) and assessing its location on T1-post-contrast images (D) can also give spatial information relative to tumor ‘bulk’. As one scans through images of combined ADC and rCBV ROIs (E), further scenarios can be presumed (F): in the ‘necrotic core’, cellular regions with adequate perfusion suggest a population residing in regions of adequate oxygen and nutrient supply (O); cellular regions with lowered blood volume (arrow), however, suggest a population adapted to a hypoxic and acidic microenvironment conditions. Note how these advanced methods also suggest that the conventional ‘necrotic core’ may harbor cells and possess regional blood supply.
ADC: Apparent diffusion coefficient; GBM: Glioblastoma; rCBV: Relative cerebral blood volume.

