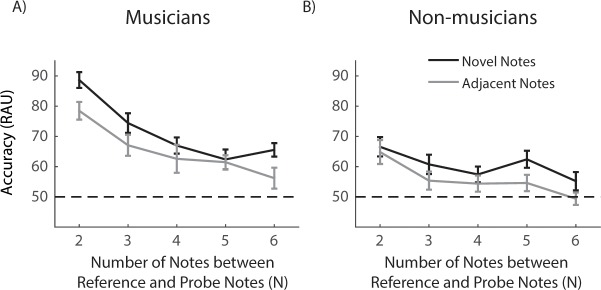
Fig 5. Comparison between the novel and adjacent notes in the N-back tonal task.
Performance of musicians (A) and non-musicians (B) as a function of the notes between the reference and probe notes (N) when the probe note was a novel note (black curve) or identical to a note adjacent to the reference note (grey curve). The performance is plotted as the accuracy (RAU). Horizontal dash lines in all plots represent the chance level. Error bars are corrected S.E.M across participants.

