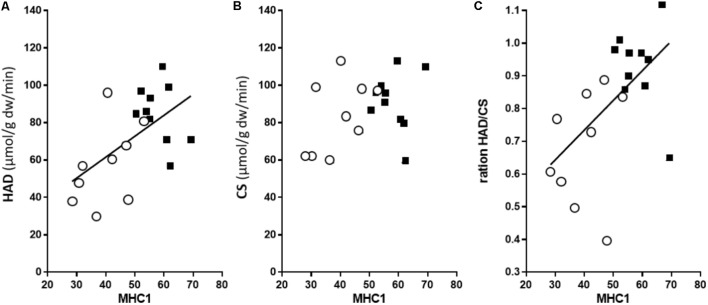
FIGURE 2.
The relationships between the percentage of MHC-1 and 3-hydroxyacyl-CoA dehydrogenase activity (HAD, n = 10) (A); citrate synthase activity (CS, n = 9) (B); and relative capacity to oxidize fat (HAD/CS ratio) (C). The open circles depict data for the arms and the leg black squares for the legs. For the arm and leg combined, there was a significant correlation between the MHC-1 content and HAD activity (r2 = 0.32, P = 0.011), as well as the HAD/CS ratio (r2 = 0.27, P = 0.021).

