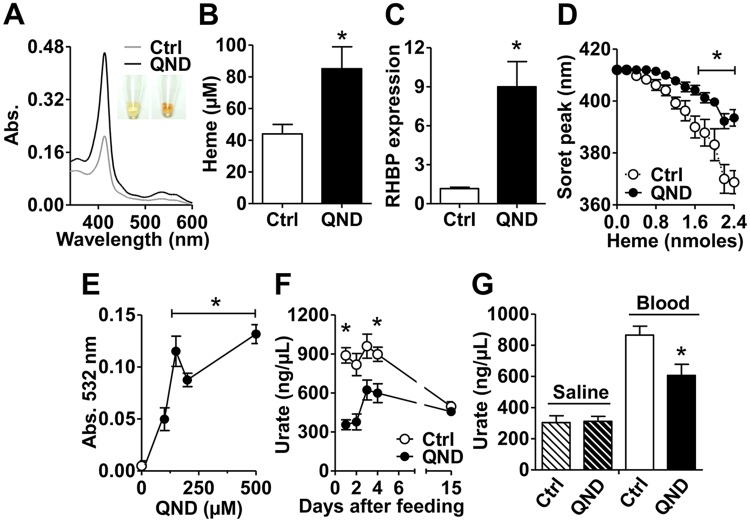
Fig 3. Limited Hz formation causes systemic heme overload, activation of compensatory heme detoxification mechanisms, and redox imbalance.
Insects were fed with blood (Control, Ctrl), or blood supplemented with quinidine (QND) and analyzed four days (A-E,G) or along fifteen days (F) after feeding. All experiments were conducted using insects from IBqM colony. (A) Light absorption spectra of hemolymph. Insets show the dark reddish-color of hemolymph from control and QND treated insects. (B) Total heme concentrations in the hemolymph. Ctrl: n = 17; 100 μM QND: n = 16. Comparisons between groups were done by Student’s t test (*p<0.01). (C) Relative expression of Rhodnius heme-binding protein (RHBP) in fat bodies. Ctrl: n = 3; 100 μM QND: n = 3. Comparisons between groups were done by Student’s t test (*p<0.005 relative to Ctrl). (D) Heme buffering capacity of hemolymph from the insects. Ctrl: n≥4; 100 μM QND: n≥3. Comparisons between groups were done by two-way ANOVA and a posteriori Bonferroni’s tests (*p<0.05). (E) Lipid peroxide levels in the hemolymph. Ctrl: n = 4; QND: n≥6. Comparisons between groups were done by one-way ANOVA and a posteriori Tukey’s tests (*p<0.05 relative to Ctrl). (F) Urate levels in the hemolymph. Ctrl: n≥3; 100 μM QND: n≥3. Comparisons between groups were done by two-way ANOVA and a posteriori Bonferroni’s tests (*p<0.05 relative to Ctrl). (G) Urate levels in the hemolymph from insects fed with saline (Ctrl, n = 8), saline supplemented with 100 μM QND (n = 9), blood (Ctrl, n = 44), or blood supplemented with 100 μM QND (n = 46). Comparisons between groups were done by Mann Whitney´s test (*p<0.0005 relative to Blood Ctrl). Data in Figs 3B-3G were expressed as mean ± S.E.M.

