Figure 3.

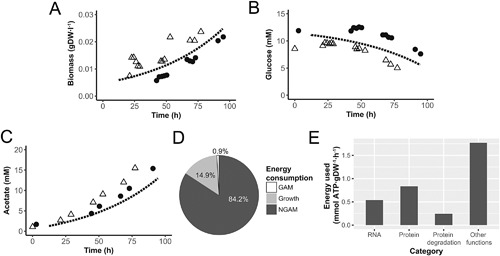
Metabolite profiles and energy balances in standard M. hyopneumoniae fermentations. Comparison of model predicted aerobic batch profiles (dashed line) to measured profiles in fermentation batches (N = 2, dots and pyramids) for: (A) biomass, (B) glucose, (C) acetate concentration, (D) distribution of energy consumption, and (E) major growth related energy consumption.
