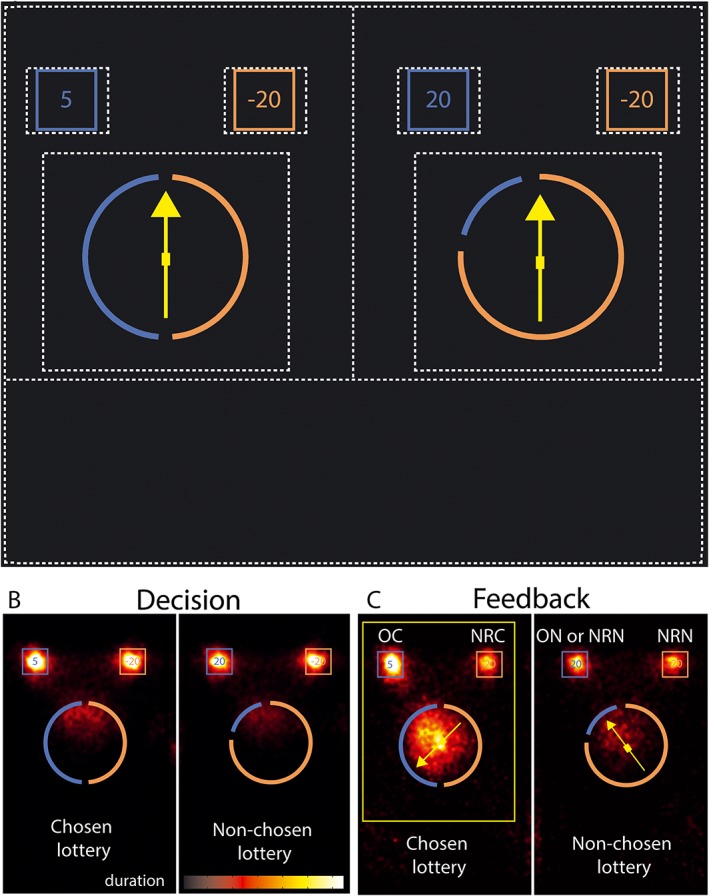
Figure 1.

(A) Example of two lotteries presented at the beginning of the trial. The portions of each arc represent the probability associated with the payoffs depicted in the square box above each portion. Here, the left lottery has a 50% chance of earning 5 euros and a 50% chance of losing 20 euros. The right lottery has a 20% chance of earning 20 euros and an 80% chance of losing 20 euros. Probabilities can take values {.5, .2, .8}, and payoffs can take any value within {−20, −5, +5, +20}.The dotted lines represent the AOIs considered for the analyses, one large AOI for each lottery one for each monetary amount and for each probability wheel. (B) Distribution of fixation points on the chosen and non‐chosen lotteries during the decision period, weighted by the fixation duration, for all trials and participants. The fixation points are plotted on one example pair of gambles: 58.74% of the total number of fixations occurred in the monetary amounts AOIs and 23.20% in the wheels AOIs. (C) Distribution of fixation points on chosen and non‐chosen lotteries, obtained and non‐realized outcomes during the feedback period, weighted by the fixation duration, for all trials and participants. OC, obtained‐chosen; NRC, non‐realized‐chosen; ON, outcome‐non‐chosen; NRN, non‐realized‐non‐chosen. Of the fixations, 34.27% occurred in the monetary amounts AOIs and 48.10% in the wheels AOIs; 5.60% of the fixations were located in the place of the future location of the emotional scale, in anticipation of its appearance
