Figure 1.

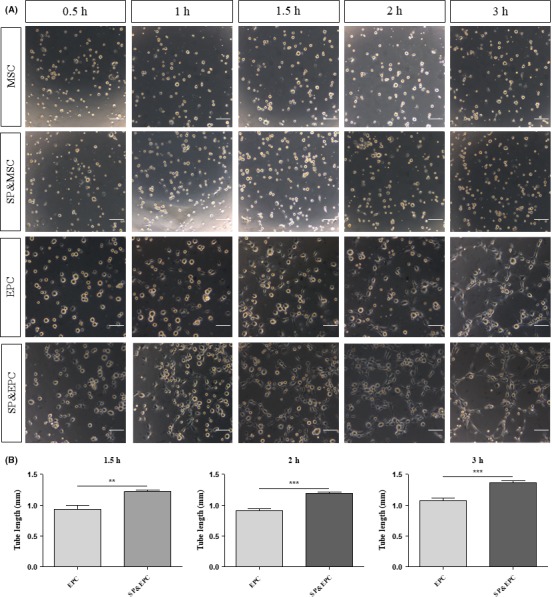
Tubular network‐forming capacity of BM‐MSCs and BM‐EPCs with or without SP treatment. (A) BM‐MSCs or BM‐EPCs were seeded at 2 × 10⁴ cells/well on Matrigel‐coated wells in a 48‐well plate with or without 100 nmol/L SP. Phase‐contrast images were taken at indicated time points under a stereomicroscope. Scale bar = 50 μm. (B) The quantification of tube length in the vascular tube structure was measured using Image J. Data are presented as mean ± SEM (**P < .005, ***P < .0005, student's t test)
