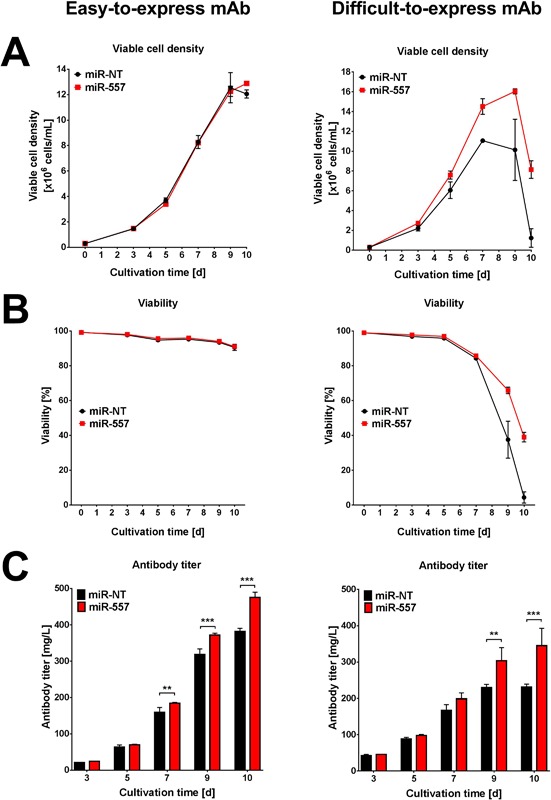
Figure 4.

Analysis of fed‐batch performance of stable cell pools either producing an easy‐to‐express or difficult‐to‐express antibody candidate. (A) Viable cell density, (B) viability and (C) volumetric antibody titer of pools co‐expressing either miR‐557 (red) or miR‐NT (black) are shown for a 10‐day fed‐batch cultivation process in 250 mL shake flasks. The left panel represents results of an easy‐to‐express and the right panel for a difficult‐to‐express mAb. Data are presented as mean value and error bars represent the SD of three independent cultivations. For statistical analysis a two‐way ANOVA was applied comparing the mean values of the different miRNA overexpressing cell pools at each time point (**P < 0.01; ***P < 0.001).
