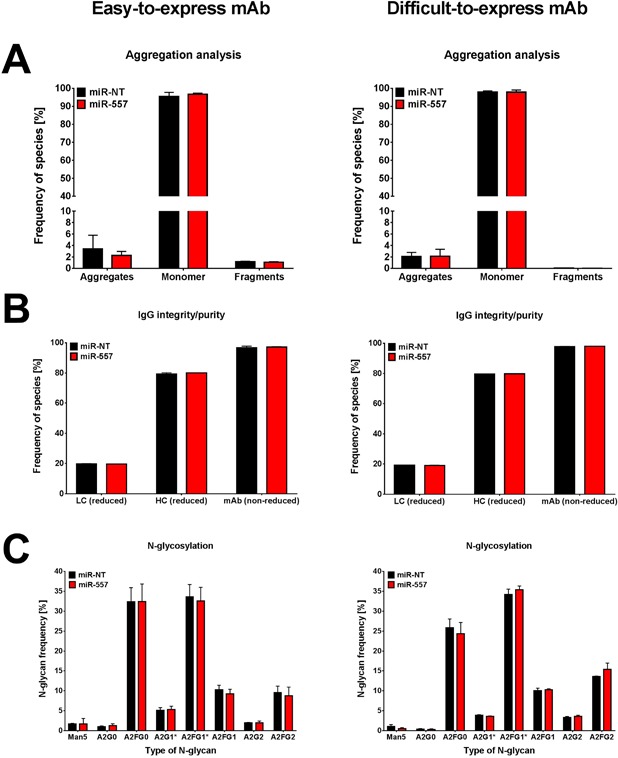
Figure 9.

Analysis of product quality attributes of monoclonal antibodies produced by miRNA engineered CHO host cells. Data are presented for both easy (left panel) as well as difficult‐to‐express mAb (right panel). (A) Analysis and quantification of aggregates, fragments as well as monomers of mAbs produced by miR‐557 (red) compared to miR‐NT expressing control cells (black). Analysis was performed by Ultra‐Performance Size‐Exclusion Chromatography (UP‐SEC) using a priori Protein A purified antibodies. (B) Separation and quantification of antibody light (LC) and heavy chain (HC) as well as assembled mAb was achieved using capillary electrophoresis (CE) at either reducing or non‐reducing conditions to examine purity and integrity of produced antibodies. (C) Analysis and quantification of N‐linked glycan structures present on mAbs. Separation of N‐glycans was performed using CE using a priori Protein A purified antibodies. Samples for product quality analyses were taken from culture supernatant of ambr®15 fed‐batch cultivation runs at day of harvest. Data are presented as mean ± SD of three different cell clones (TOP 3 clones).
