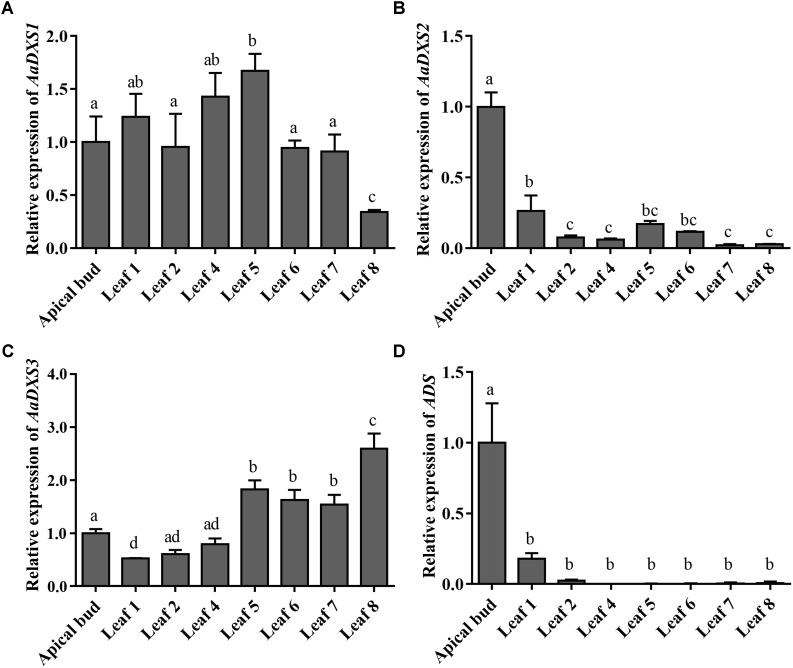
FIGURE 5.
Relative expression levels of AaDXS1–3 and artemisinin biosynthesis gene, AaADS, in the apical bud and in leaves at different positions on the stem. (A) AaDXS1; (B) AaDXS2; (C) AaDXS3; and (D) AaADS. Different letters above the bars represent statistically significant differences (p < 0.05) detected by Duncan’s multiple test. Data represent mean ± SD of three biological replicates.

