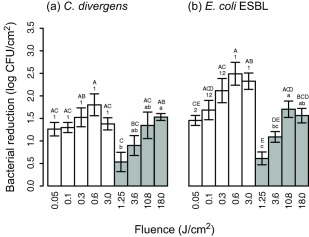
Figure 3.

Reductions of (a) C. divergens and (b) ESBL‐producing E. coli on MAP‐chicken exposed to continuous UV‐C (white bars) and pulsed UV light (grey bars) at different fluences (J/cm2). A gas mixture of 60% CO2 and 40% N2 and a UV permeable top film was used for the packages. Three separate ANOVA were performed for each species, represented by upper case letters (comparing UV‐C and pulsed UV light treatments), numbers (comparing UV‐C light treatments) and lower case letters (comparing pulsed UV light treatments). Samples containing the same letter/number were not considered different
