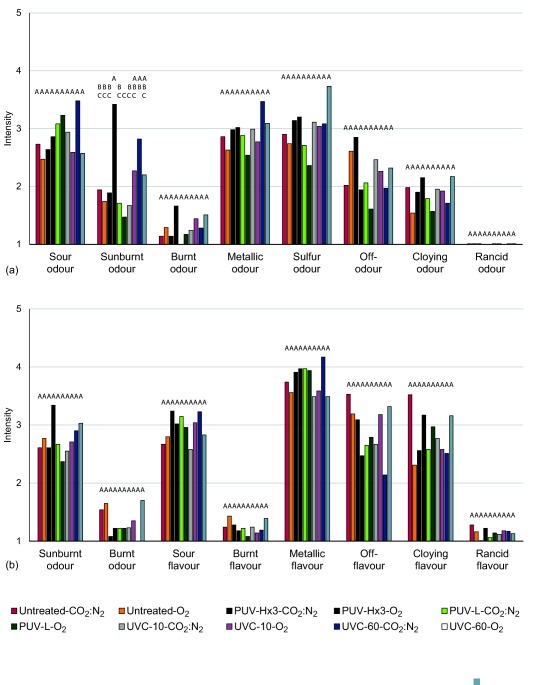
Figure 5.

Sensory analysis of (a) raw chicken fillet samples and (b) cooked chicken fillet samples. Chicken samples were exposed to continuous UV‐C light at 10 mW/cm2 for 10 s (UVC‐10) and 60 s (UVC‐60), giving fluences of 0.1 J/cm2 and 0.60 J/cm2, respectively, and pulsed UV light to a low pulse with fluence of 1.25 J/cm2 (PUV‐L) and three times to a high pulse giving a fluence of 10.8 J/cm2 (PUV‐Hx3), both in air (O2) and anaerobic (CO2 : N2) atmospheres, representing unpackaged chicken and MAP‐chicken, respectively. The intensities of different odors of raw samples and odor/taste/flavor of cooked samples were registered, 1 = no intensity and 9 = high intensity. The letters above the columns indicate grouping according to ANOVA and Tukey multiple comparison test. Samples with the same letter are considered being equal for the specific property
