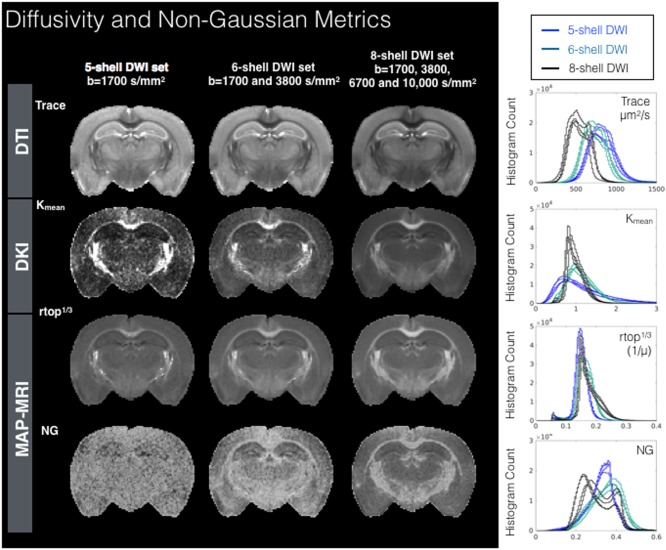
Figure 2.

Metric maps and histograms for DTI, DKI, and MAP‐MRI models fit using diffusion weighted data from three sampling schemes having five, six, and eight shells. Maps are shown for a representative slice for each DWI sampling scheme and whole brain density histogram plots are shown (right column) for each of four mouse brain samples. Abbreviations: Kmean, mean kurtosis; NG, non‐Gaussianity; rtop, return to the origin probability.
