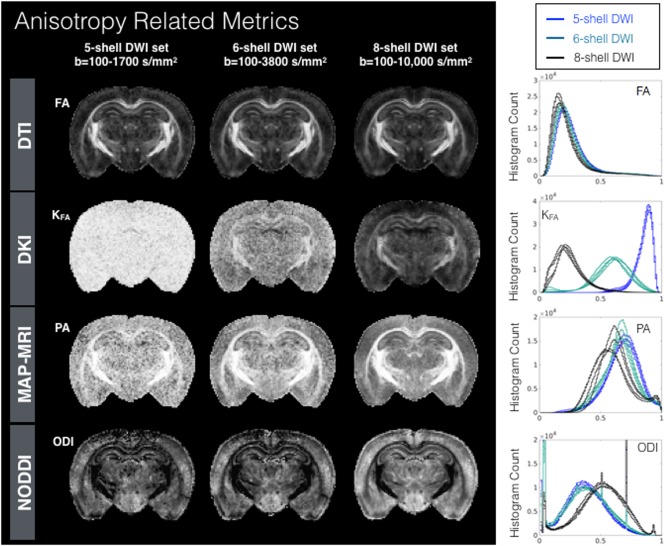
Figure 4.

Metric maps and histograms to probe water anisotropy for DTI, DKI, MAP‐MRI, and NODDI models fit using diffusion‐weighted data from three sampling schemes having five, six, and eight shells and density histogram plots (right column) for each metric in four mouse brain samples show the distribution of metric values. PDF histograms are normalized bin counts of metric values (x‐axis) and CDF histograms are the cumulative normalized bin counts for the metric value. Abbreviations: FA, fractional anisotropy; KFA, kurtosis FA; ODI, orientation dispersion index; PA, propagator anisotropy.
