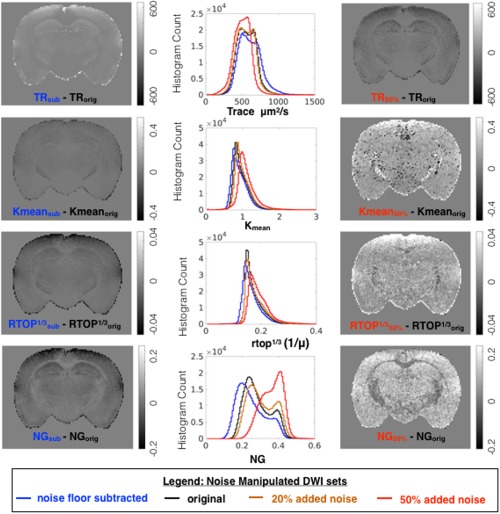
Figure 5.

Effects of signal transformation and added noise for metric maps related to diffusivity and non‐Gaussianity. For each metric, whole brain histograms are shown for modeling of the original DWI dataset (black) and of the same dataset following noise floor subtraction (blue), addition of 20% or 50% rectified noise (orange and red, respectively). To visualize the localization of metric differences resulting from noise manipulation, difference maps are shown for the same slice.
