Figure 9.

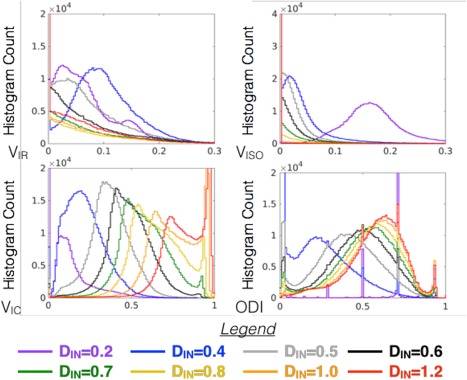
Whole brain histograms for compartmental and orientation compare the distribution of metric values generated by NODDI modeling over a range of DIN values corresponding to the maps shown in Figure 8.

Whole brain histograms for compartmental and orientation compare the distribution of metric values generated by NODDI modeling over a range of DIN values corresponding to the maps shown in Figure 8.