
Figure 10.
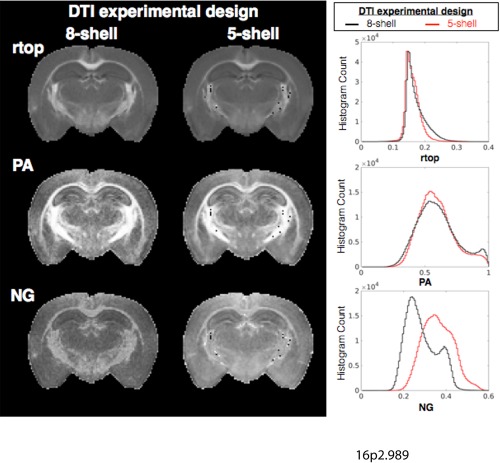
The effects of initial tensor estimation on MAP‐MRI metrics. Maps of rtop, PA, and NG are shown for the same slice after MAP modeling performed using an estimate for the diffusion tensor based on all DWIs (eight‐shell, left column) or based on only low b‐value DWIs (five‐shell, right column). Whole brain histograms are also shown to report systematic differences in MAP‐MRI metrics that are the consequence of the initial tensor fitting. Abbreviations: NG, non‐Gaussianity; PA, propagator anisotropy; rtop, return to the origin probability.