
Figure 2.
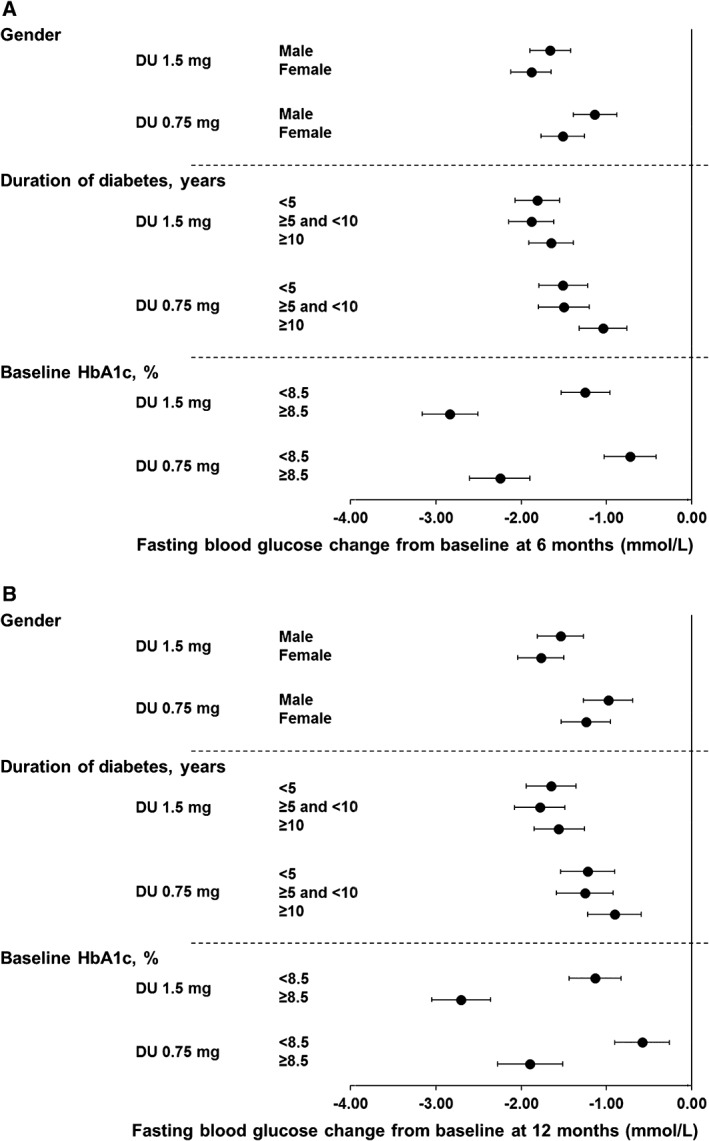
Change of FBG from baseline at A, 6 months and B, 12 months. Data are LS means (95% CI), intention‐to‐treat, LOCF ANCOVA analysis. DU, dulaglutide
Official websites use .gov
A
.gov website belongs to an official
government organization in the United States.
Secure .gov websites use HTTPS
A lock (
) or https:// means you've safely
connected to the .gov website. Share sensitive
information only on official, secure websites.
Change of FBG from baseline at A, 6 months and B, 12 months. Data are LS means (95% CI), intention‐to‐treat, LOCF ANCOVA analysis. DU, dulaglutide