
Figure 4.
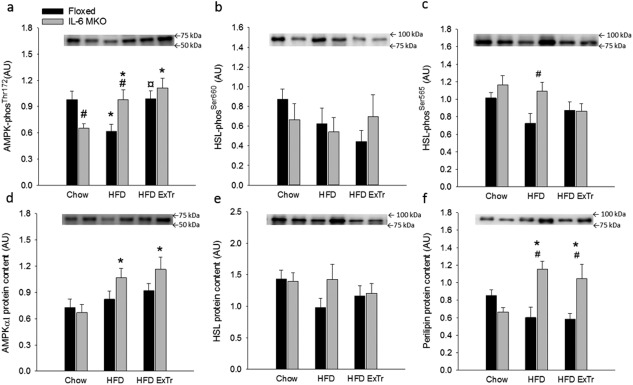
Regulation of AMPK and HSL in iWAT in Floxed and IL‐6 MKO mice after 16 weeks on Chow, HFD, or HFD combined with exercise training (HFD ExTr). (a) AMPKThr172 phosphorylation (phos), (b) HSLSer660 phos, (c) HSLSer565 phos, (d) AMPKα1 protein content, (e) HSL protein content, and (f) perilipin protein content (n = 9‐10). Values are mean ± SE. *Significantly different from Chow within given genotype (P < 0.05). ¤Significantly different from HFD within given genotype (P < 0.05). #Significantly different from Floxed within given intervention (P < 0.05).