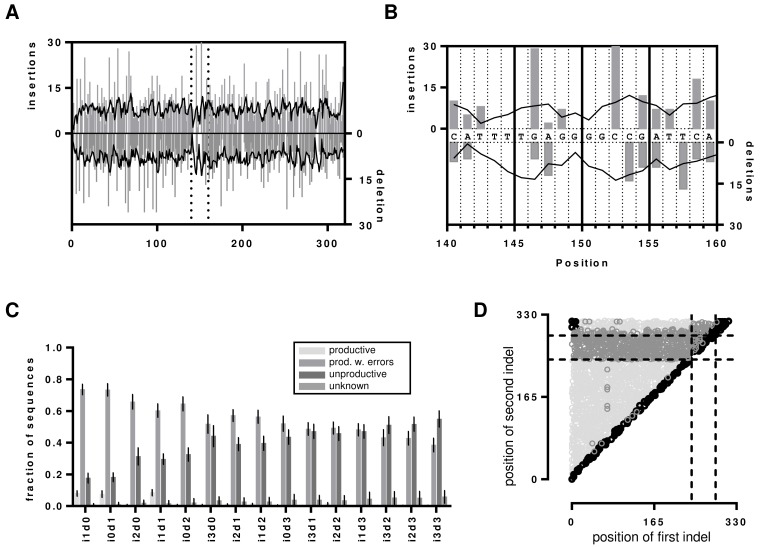
Figure 2. Indels in the artificial dataset.
A. Insertion and deletion events displayed as determined by graphical alignments of the reference sequence to the i1d0 and i0d1 dataset of hybridoma 1. Grey bars represent the actual detected indel and the black line presents the moving average over 4 neighbors. The dotted vertical lines represent the segment that is magnified in B. to visualize the problem of determining the position of indels within homopolymer repeats. C. Indel detection rates by IMGT HighV-QUEST processing shown as bar chart with error bars indicating the SD over all 7 datasets. D. Visualization of frame-shift masking indel proximity in Hybridoma 1 i1d1 dataset. The nt positions of the first and second indel before correction are shown as scatterplot. Dotted lines indicate the position of the IMGT IGH junction. Productive sequences with detected indels are shown in light grey, unproductive sequences are shown in dark grey. Sequences without detected errors are shown in black. The remaining i1d1 indel proximity graphs are shown in the supplementary Figure 1.

