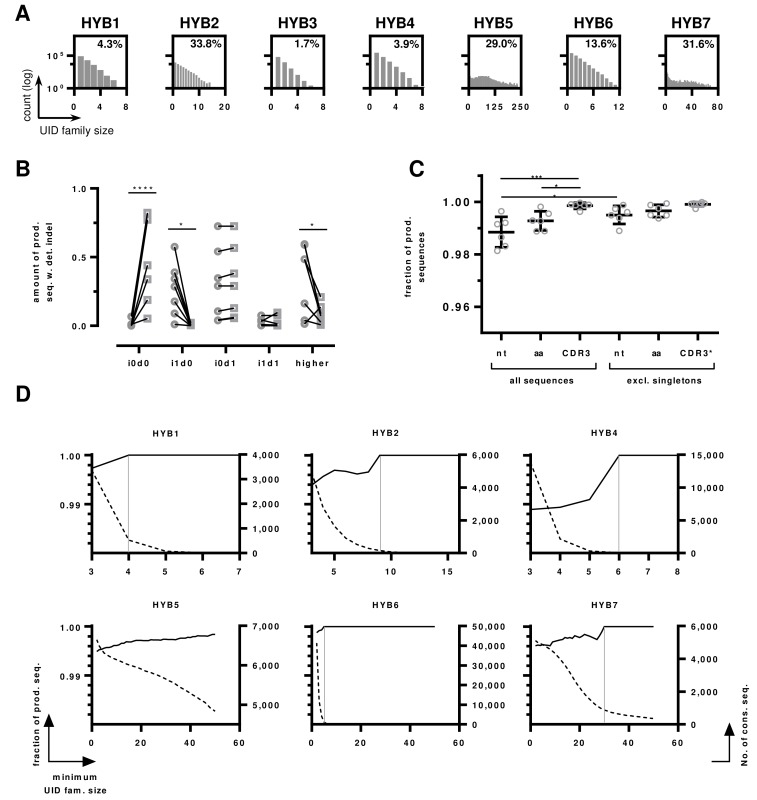
Figure 5. HTS data of monoclonal hybridomas libraries.
A. UID family size distributions per sample. The number of UID families (log transformed) is plotted by the number of reads assigned to a ssUID per hybridoma. The amount of UID families containing a minimum of 3 reads are indicated as percentage value. B. Indel distributions on productive sequences with detected errors before and after IMGT HighV-QUEST processing. The amount of indel-free (i0d0), single insertions (i1d0), single deletions (i0d1), one single insertion and deletion (i1d1) and higher permutations (“higher”) are shown as fraction of productive reads with detected indels before (circles) and after (squares) IMGT HighV-QUEST error correction. Statistical differences are indicated with **** p < 0.0001, * p < 0.05 determined by multiple two-tailed t-test with Holm-Sidak's method to account for multiple testing. C. The influence of removing singletons on the number of error-free sequences in the productive dataset. The fractions of total sequences without detected indels are shown as boxplot with mean and ± SD. Data are shown for all nucleotide sequences (nt), amino acid sequences (aa) and CDR3s for all sequences and data without singleton sequences. CDR3* indicates that for this set, singletons were determined on the full-length amino acid sequences. P values are indicated *** p < 0.001, * < 0.05, One-way ANOVA with Sidak's post-hoc test. All other differences were not statistically significant. D. Influence of UID family size on the number of correct sequences. The number of correct sequences are shown as black line per minimum UID family size (left y-axis). The number of consensus sequences are shown as dotted line per minimum UID family size (right y-axis). The UID family size at which all sequences are correct is indicated by a grey vertical line for Hybridoma 1,2,4,6 and 7, the dataset of Hybridoma 5 does not reach 100% correct sequences.

