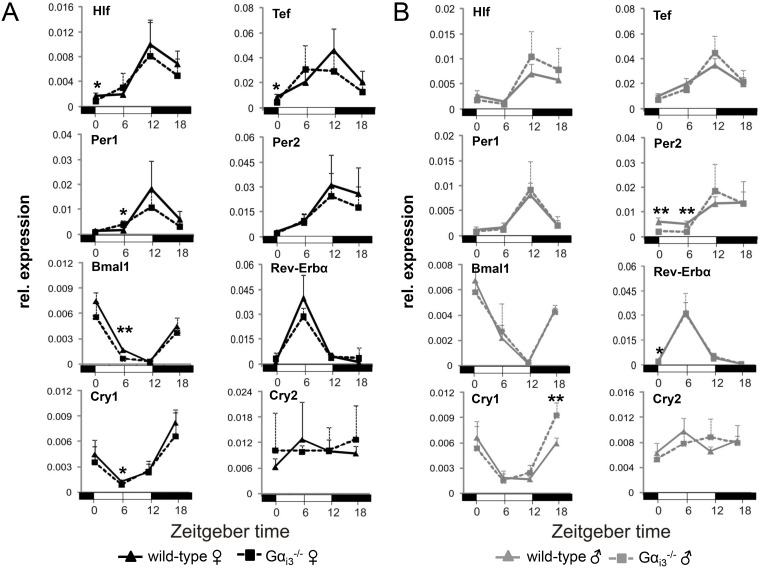
Figure 1. Rhythmic expression of core clock genes and clock-regulated genes in the liver of Gαi3-/- mice.
Quantitative real-time PCR analysis of rhythmic expression of core clock genes and clock output genes in the liver of female (A) and male (B) Gαi3 deficient mice vs. wild-type control animals. Mice were sacrificed and analyzed every six hours at the indicated time points (ZT 0 to ZT 18). Transcript levels of the indicated genes were normalized to the endogenous control Gapdh. Shown are 2-ΔCt values. Results are expressed as mean ± s.d. of six animals analyzed per genotype and time point (*p < 0.05; **p < 0.01 as compared to corresponding wild-type control animals).

