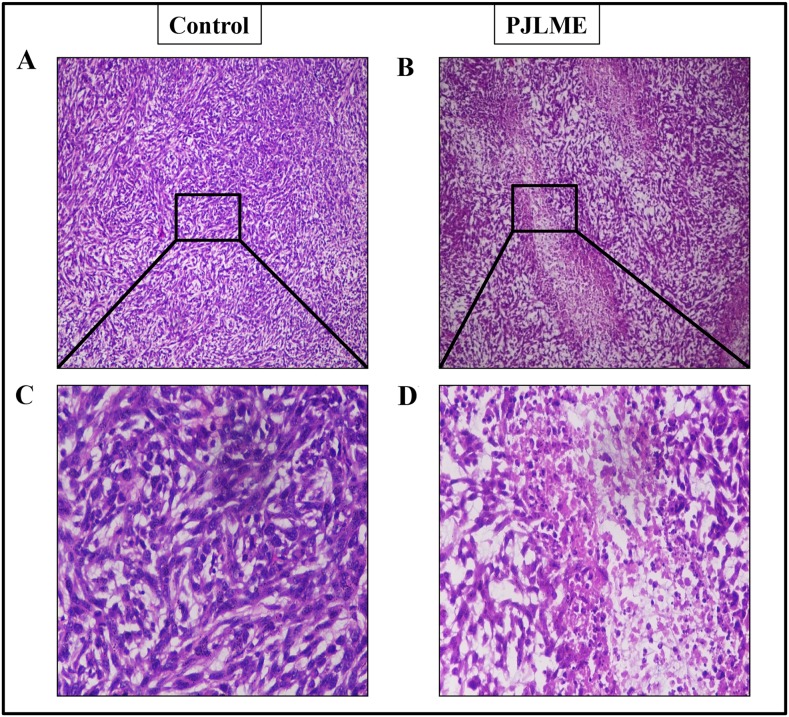
Figure 12.
(A-D) Representative images of the histopathological analysis of PJLME treated and control tumors isolated from the mice. (A) and (C), histopathological images of tumors from Group-1 (control) mice at 10x and 40x magnification respectively, (B) and (D) histopathological images of tumors from Group-2 (PJLME 20mg/Kg/day) mice.

